The Freight and Fuel Transportation Optimization Tool
Explore Optimal Transportation Solutions for Freight and Supply Chain Scenarios
Rationale
Freight and fuel supply chains provide access to essential goods and services and are dependent on transportation infrastructure. Supply chain planners want to identify transportation solutions that maximize supply chain delivery or other factors. In addition, they want to understand how those solutions change under different supply chain and network conditions.
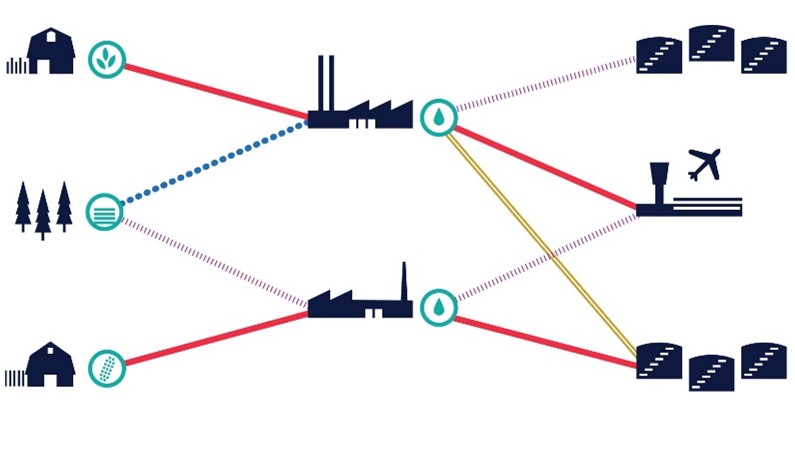
The U.S. DOT Volpe Center developed the Freight and Fuel Transportation Optimization Tool (FTOT) as a flexible scenario-testing tool that optimizes the transportation of materials for energy and freight scenarios. The tool is designed to analyze the transportation needs and constraints associated with material collection, processing, and distribution to provide an optimal solution to supply chain routing and flows. FTOT can analyze a variety of commodities, datasets, and assumptions, and is customizable to each user’s particular needs and questions.
FTOT can:
-
Optimize routing and flows of user-defined supply chain scenarios over a multimodal transportation network.
-
Estimate optimal cost of routing solutions and the associated releases, vehicle-distance traveled, facility utilization, and other metrics by commodity, mode, and/or facility.
-
Identify candidate facility locations based on optimized transportation patterns if processing locations are not already established.
-
Generate summary reports, maps, and visualizations, including interactive dashboards.
-
Facilitate scenario comparisons and enable disruption and resilience analyses with additional tools.
With these capabilities, FTOT can elucidate the impacts of changes to commodity demand and supply, industry infrastructure, and the transportation network.
FTOT Can Help Supply Chain Stakeholders Answer Critical Questions
Optimal Supply and Demand
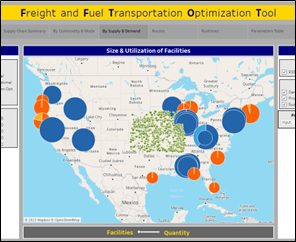
What commodity quantities are supplied, processed, and consumed in an optimal transportation solution?
Multimodal Transportation Infrastructure
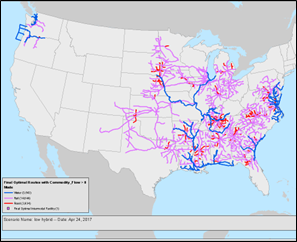
What are the optimal flows and their associated costs and releases by mode and commodity?
Facility and Industry Infrastructure
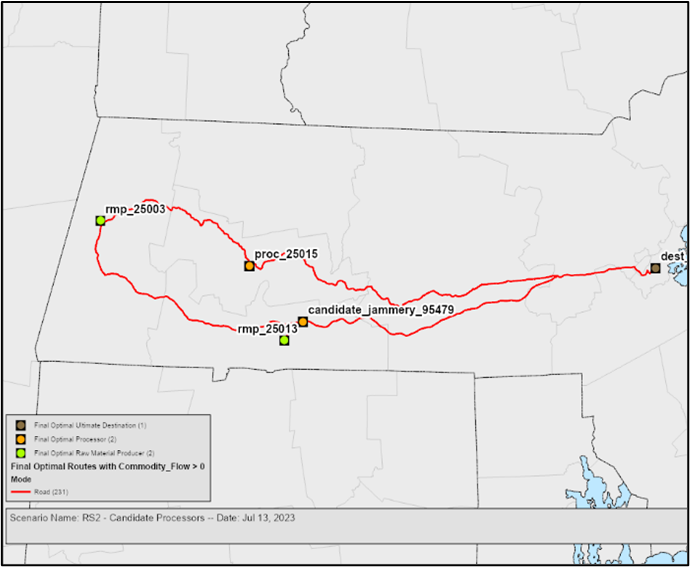
What future processor locations should be considered based on optimized transportation patterns?
Disruption and Resilience
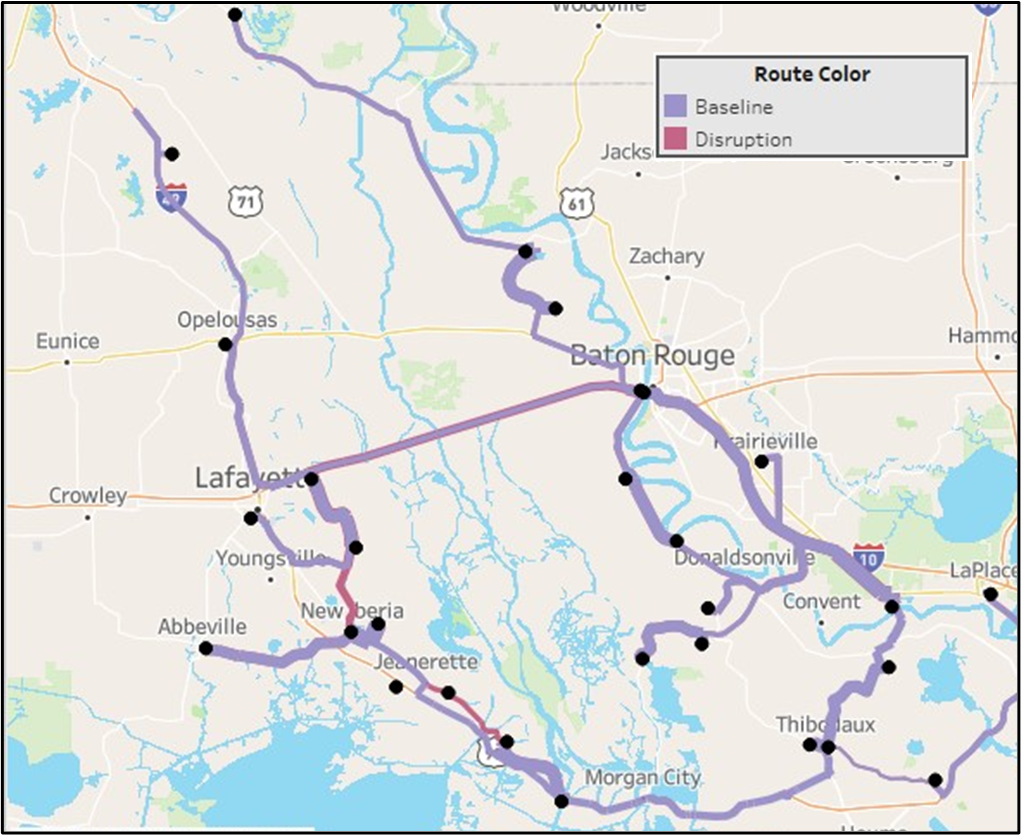
How do the optimal routing solution and costs change during a disruption when certain transportation links are unavailable?
The public version of FTOT was developed and is executed by the U.S. DOT Volpe Center and sponsored by FAA, with additional support and use by U.S. Department of Energy, the Office of Naval Research, FHWA, PHMSA, and Oregon State University.

