Innovative Uses of Data Science to Solve Transportation Problems
State DOTs, metropolitan planning organizations (MPO), and regional transportation planning agencies rely on complex data to solve the nation’s congestion, infrastructure, and equity issues. U.S. DOT Volpe Center data experts are using tools from the data science and machine learning toolbox to identify roadway safety issues and address old transportation problems in new ways. Using big data and computer vision solutions to provide state DOTs with new sources of roadway infrastructure data and natural language processing (NLP), the U.S. DOT Volpe Center is creating new methods of ingesting and processing data from multiple sources.
Understanding Travel Patterns and Roadway Safety in Public Lands

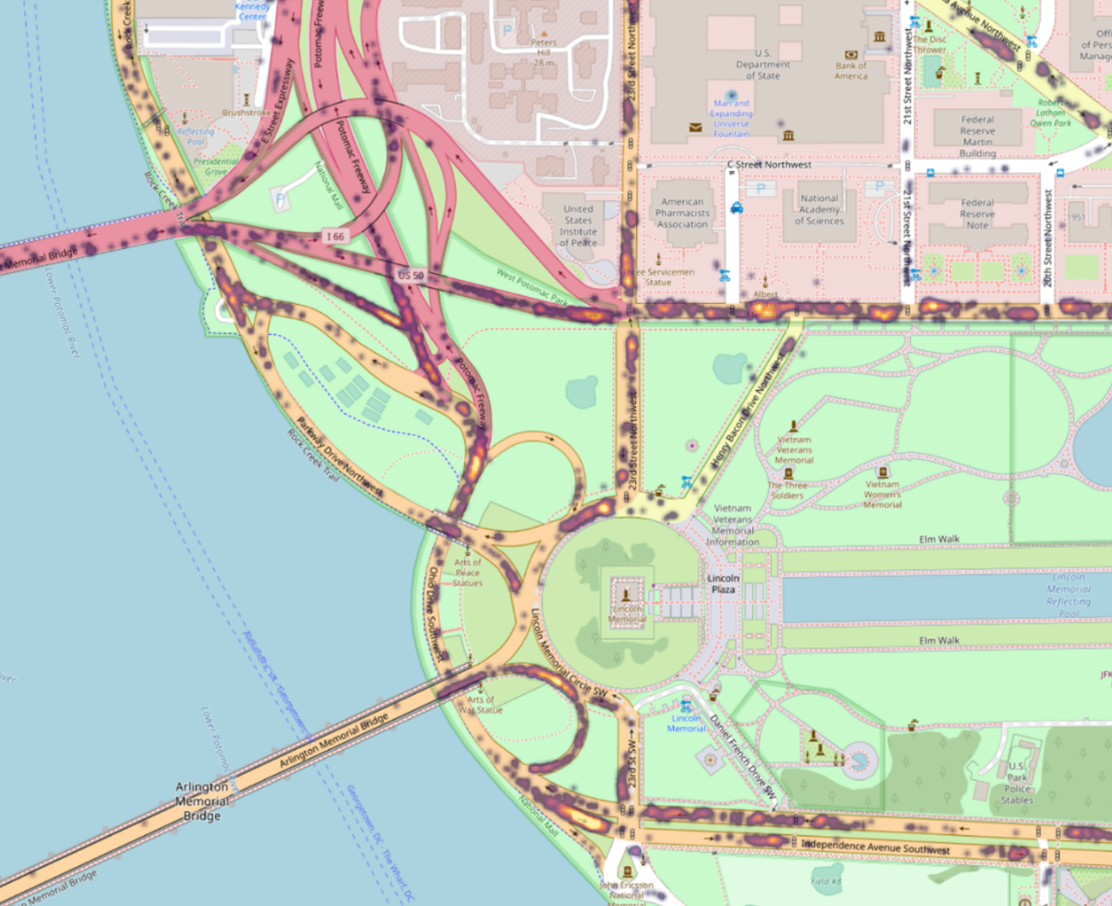
Efforts to reduce traffic congestion, identify safety risks, and improve visitor experience are often hampered by a lack of relevant data. U.S. DOT Volpe Center researchers are evaluating and analyzing emerging data sources to understand visitor movement and improve planning, management, and operations at public lands. A selection of these data include Strava Metro, Wejo, StreetLight Data, AllTrails, and U.S. DOT’s nationwide archive of Waze traffic alerts and traffic jams.
Planning efforts at Adirondack High Peaks Region used Waze’s traffic alerts, along with trail information on AllTrails, to identify key time periods when shuttle service might alleviate traffic congestion while still providing trail access, which are detailed in the New York State Adirondack High Peaks Region Shuttle Feasibility Study. Other planning efforts at Mount Rainier National Park included location based services (LBS) data, Waze traffic alerts, and biking and hiking data from Strava Metro to provide visitor home regions and a holistic view of visitor travel within and en route to the Park.
Rural Roadway Safety
The U.S. DOT Volpe Center is also collaborating with the University of North Carolina Renaissance Computing Institute (RENCI) and the North Carolina Department of Transportation (NCDOT) to develop an artificial intelligence (AI) computer vision tool for automated analysis, extraction, and annotation of roadside features on rural roads from existing video data. This information can be used to by NCDOT to more efficiently assess the safety of the roadside. The tool will help to facilitate safety initiatives more efficiently and effectively on North Carolina’s rural roadway system. AI components will also provide a blueprint for other jurisdictions and states. This project has a public GitHub repository for the code used in the tool. For more information about this project, see NCDOT’s final report or the IEEE published research paper for a more technical overview.
Waze Traffic Trends

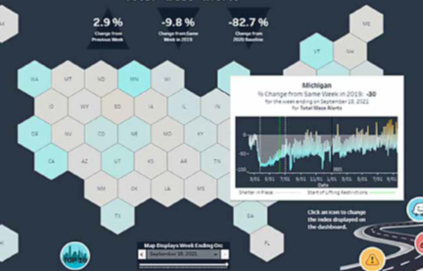
The U.S. DOT Volpe Center developed a COVID-19 Waze Traffic Alert Dashboard in March 2020 to track relative changes in weekly traffic jam alerts for all U.S. metropolitan areas. The team has continued to provide weekly updates through 2022. The Waze dashboard provides a rapid indicator of traffic jams covering all U.S. metropolitan areas, increasing accessibility to state, metropolitan, and county-level time trends.
Text Data Toolbox
Text data is a large untapped resource for the U.S. DOT. U.S. DOT Volpe Center data scientists worked OST-R to build a toolbox of NLP approaches to make tasks like summarization, comparison, and exploration of text data easier for U.S. DOT offices. For example, OST-R asked the U.S. DOT Volpe Center to develop tools to identify points of similarity for all departmental-funded research projects, which was not possible to do manually. U.S. DOT Volpe Center experts used open-source similarity techniques, tuned for the kind of text used across U.S. DOT, and created a dashboard for OST-R staff to quickly find previously unknown complementarity for research projects across the Department. U.S. DOT Volpe Center data scientists continue to build on this concept as the project develops.
Interactive GIS Tool for Tracking Transportation, Demographic Data
Historically disadvantaged populations continue to suffer from systemic inequities. Gaps exist in available knowledge and tools that hinder the ability of transportation agencies to integrate social equity considerations into transportation programs, policies, projects, and other activities. A U.S. DOT Volpe Center team developed a prototype Transportation for Social Equity (TransportSE) tool to work toward closing those gaps. The tool can improve the ability of transportation agencies at all levels to understand, visualize, and analyze transportation equity indicators (including benefits, such as access to transportation services, and burdens, such as noise and pollution) in relation to social equity variables such as race and income.
The approaches highlighted here demonstrate the U.S. DOT Volpe Center’s capabilities to use data science innovations for transportation planning, operations, safety analysis, and to improve business processes. Further expansion of these capabilities will help the U.S. DOT Volpe Center meet the requirements of increasing volumes and complexity of data, as well as the need for advanced analytics in all areas of transportation.
